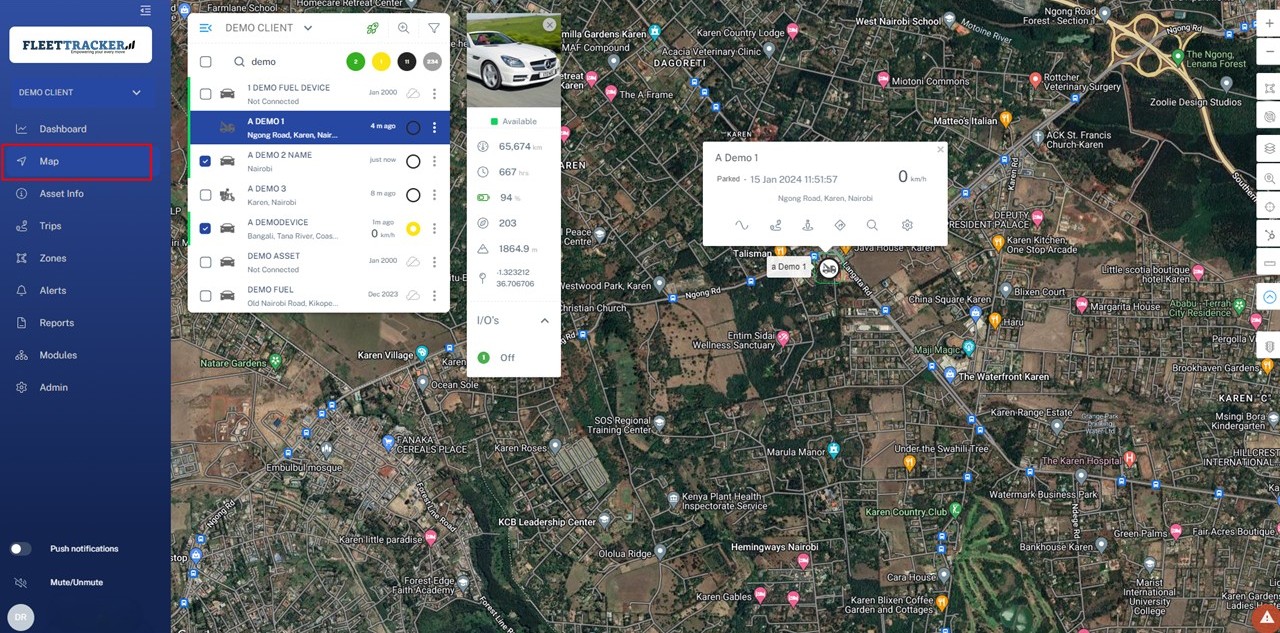
The Map page is the default page on login. This is where you do all your basic monitoring of vehicle positions and statuses. From this page you can select assets. This centers and zooms the screen to show the unit in detail with an asset bubble showing all current info. From this asset bubble you can click the links to zoom further, go to asset info, and trip replay. In the top right corner you will also find the controls for map zoom+ -, map layers, zone creation, and a measuring tool.
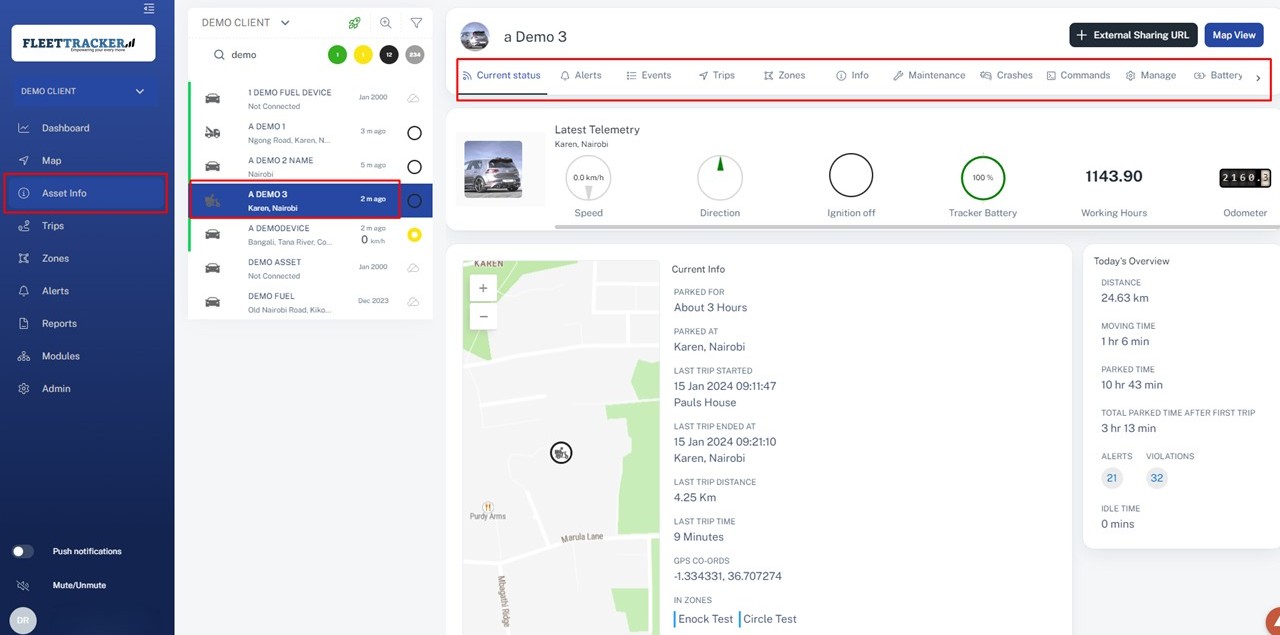
The Asset Info page is where you can access all the detailed and in depth information for a particular selected unit. At the top you will find the current status, which shows the latest data from the unit. below that you can find a telemetry button. This opens a window with the raw data messages from the unit. This is great for troubleshooting hardware! Underneath you will find various sub-tabs that you can open.
These include:
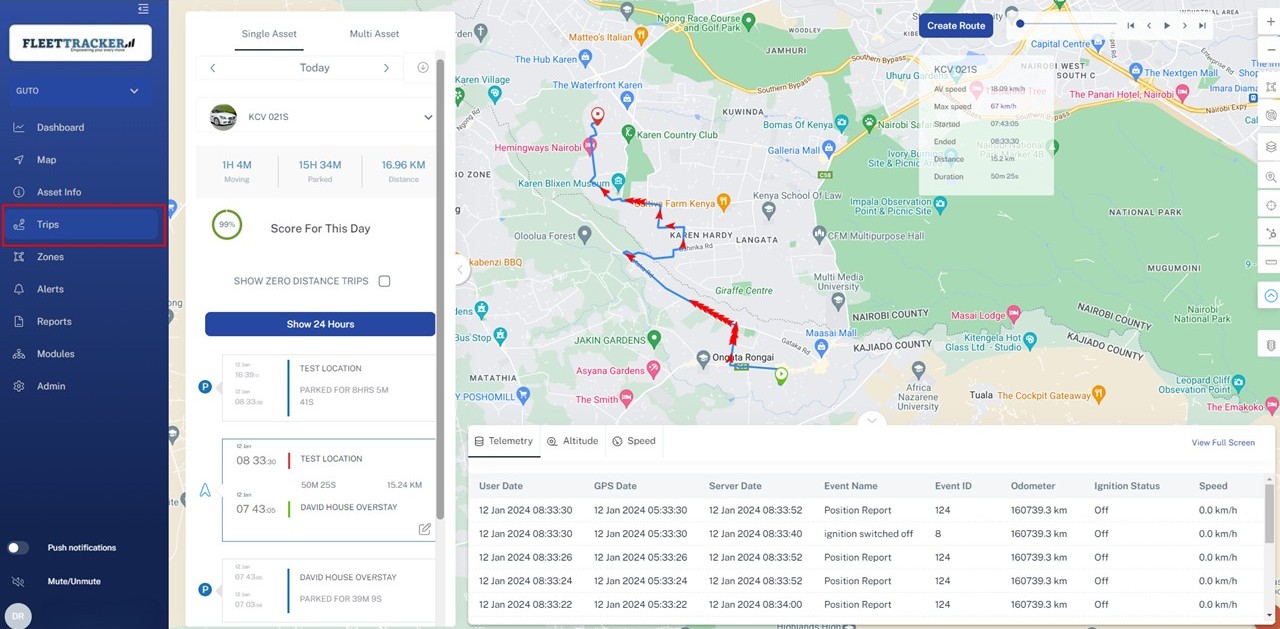
The trip replay page contains all information on the movement of the assets, on this page you can select the group of the desired asset and then the asset itself. After selecting the asset a list of the days trips will load.
After selecting a trip the trip trail with breadcrumbs will display on the map
You will also see a trip summary box at the top showing some statistics about the trip, including max. and average speed, distance and duration.
At the bottom of the replay there is a graph showing the speed variations of the asset during the trip (the green line).
This is plotted against the maximum road speed limit (the red line). You can control the animation of the replay with the controls in the top right.
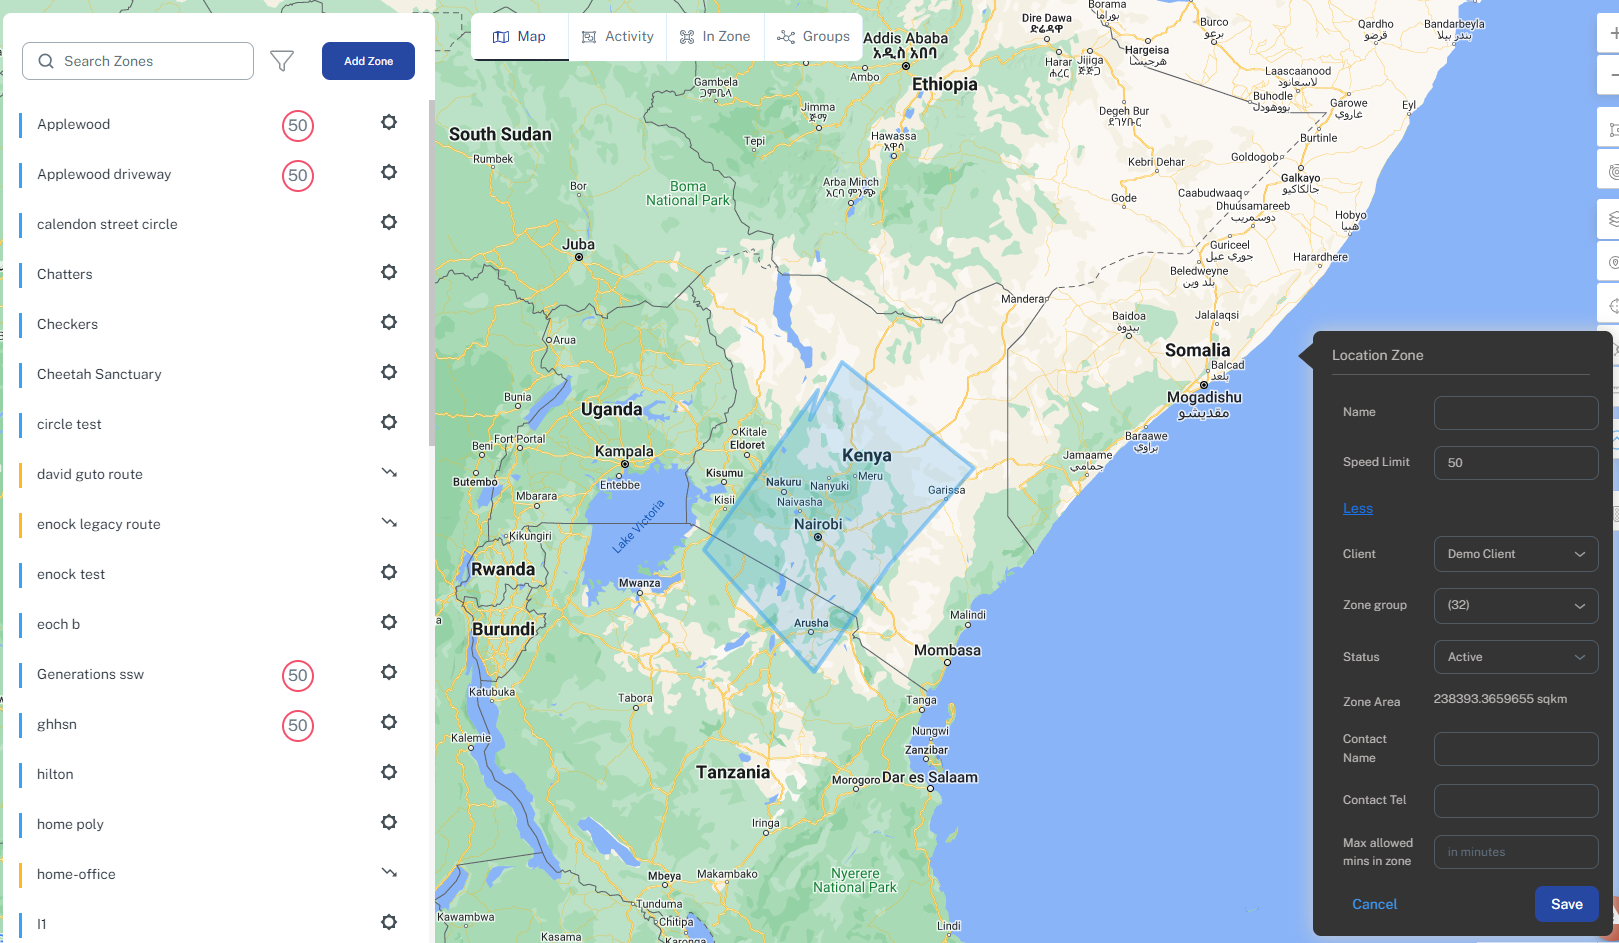
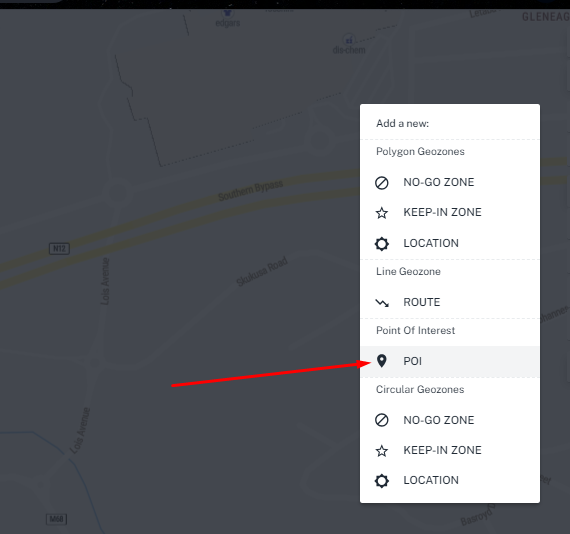
There are different types of zones, which all have different uses (Zones are also known as geo-zones or geo-fences)
The following zones exist
1. Locations
2. No Go
3. Keep In
4. Routes
5. POI
1. Locations are meant for small areas like offices, homes etc
When a vehicle enters a location zone, this location name will override the street name
i.e. if an asset is traveling up MAIN STREET, and enters into a zone called OFFICE, the asset menu will change the address from MAIN STREET to OFFICE.
No other zone types overrides the location name like a LOCATION zone.
2. No Go
Every time an assets enters/exits a no go zone, an event is saved in the database
You can generate reports based on these events, you can also create alerts with optional time periods to be notified if an asset enters a no go zone at night
3. Keep in
A keep in zone acts in the same way as a No Go Zone
4. Route
Routes are not actively monitored unless there is an alert setup.
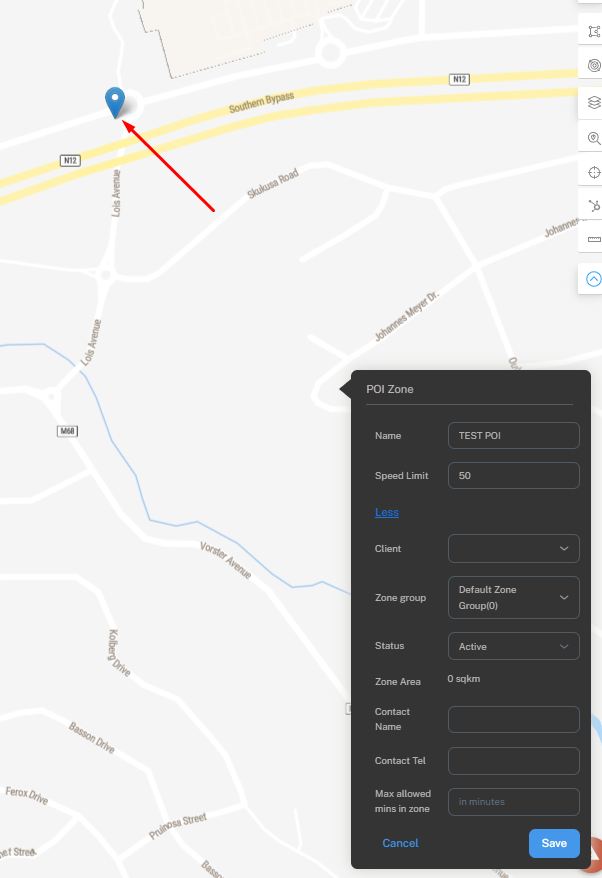
5. POI
Points of interest are simply points on the map, and are for visual purposes only - Zones that are set as inactive will not be create events
- Every zone can have a contact name and contact telephone number for information purposes
- Every zone can be assigned to a group for organisational purposes.
- If you set a max speed for a zone, this will be used as the road speed limit when the device is inside the zone)
For POI
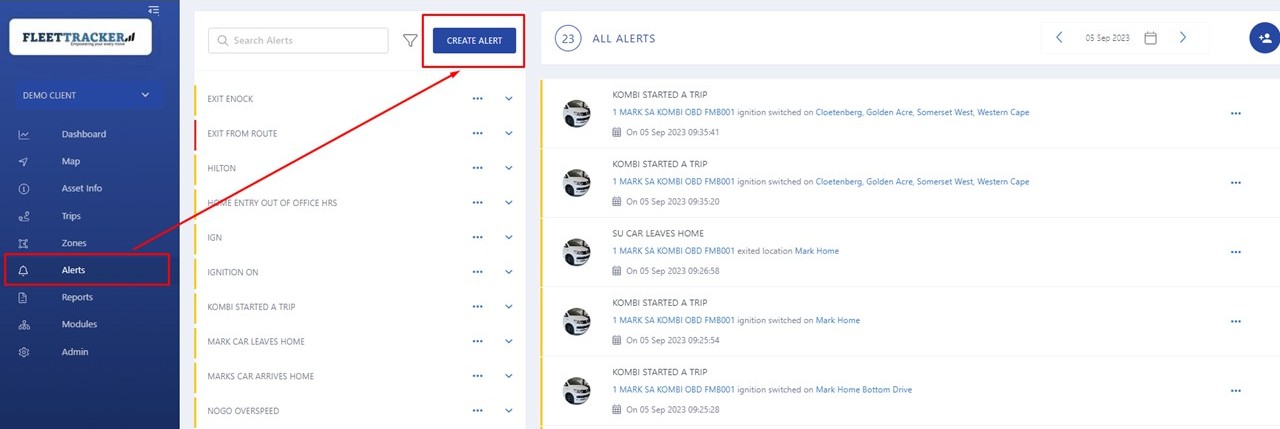
Alerts are notifications or warnings that indicate an issue, change, or action needed, typically used on the platform to help users stay informed about important events or conditions of the assets.
Below is an overview of how you can create alerts on the platform .
fill in the following details
1. alert name
2. select the client
3. set the priority
4. select the asset(s) you need to alerts on
5. select the alert trigger category, If you would like to include time-based criteria please refer to the instructions below
6. Edit the curfew details
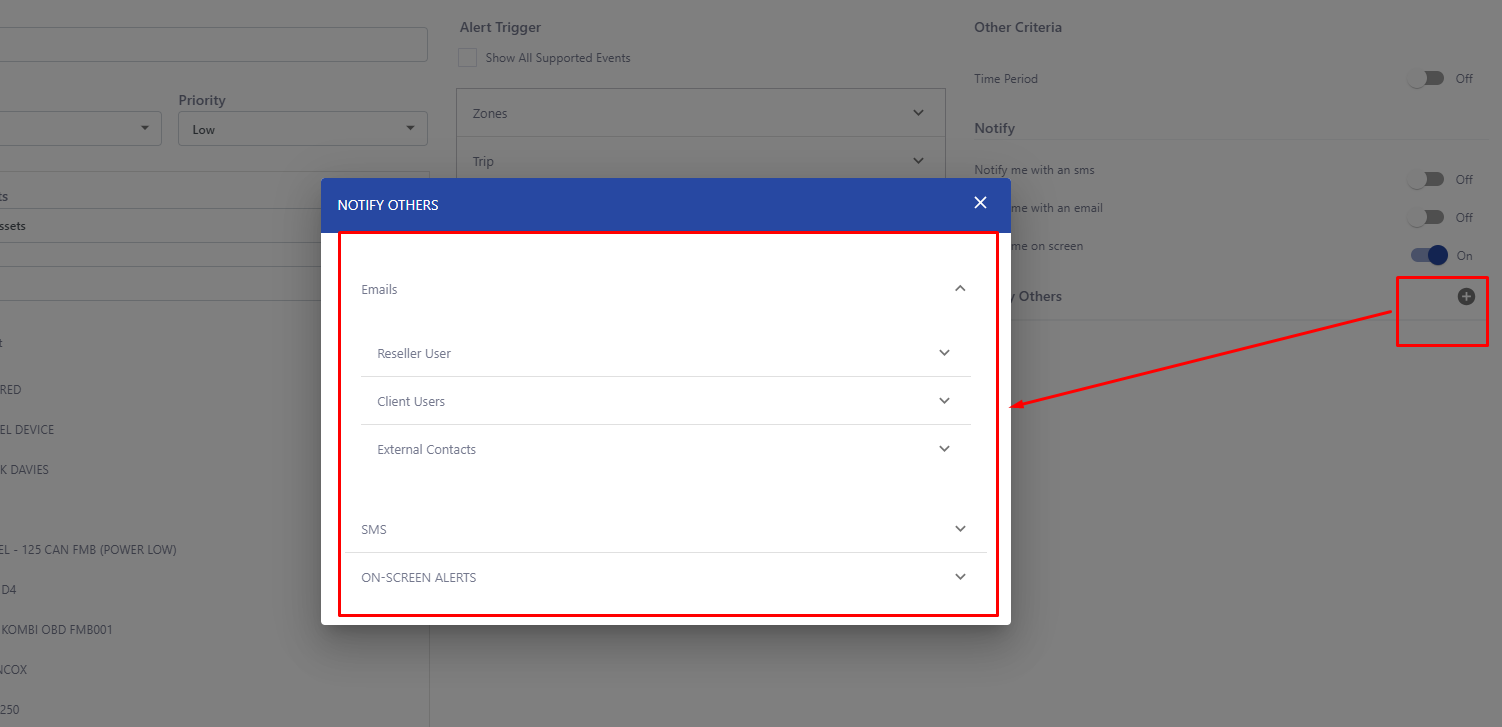
7. select the notification method
8. select the user to receive the alerts either via email, sms, push notification or onscreen
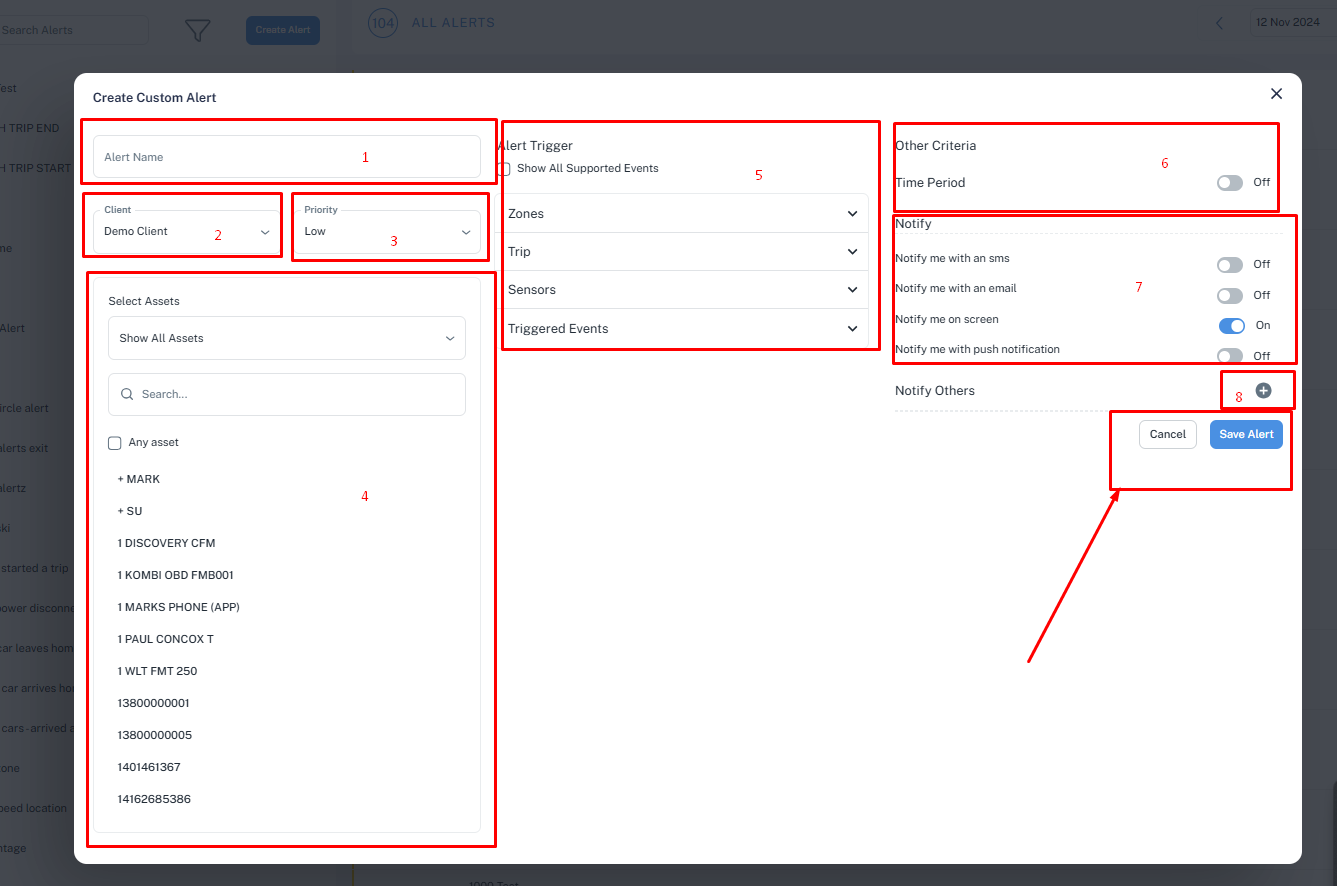
select the users to be notified.
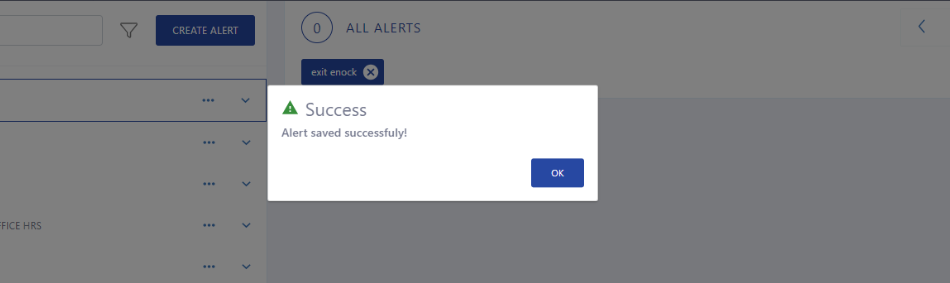
click on Save
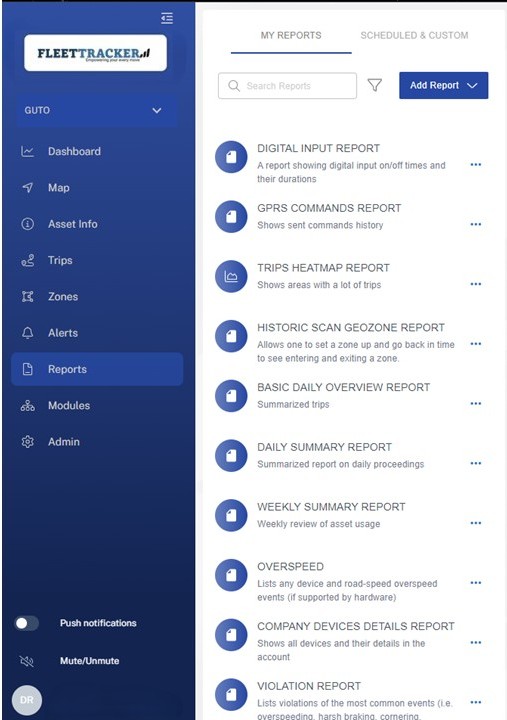
This page allows you to create and generate all your desired reports, in the top left you will see two sub tabs.
Here you can select whether to generate standard generic reports such as trip reports and violation reports or scheduled and custom reports.
In generic reports you select your desired report from the list which will bring up a pop-up where you select the parameters such as asset/s and time-scale.
This report can then be viewed in the right hand pane and also exported using the controls at the top.
In scheduled and custom reports, using the create report button, which brings up a pop-up with advanced report options. here you can customize the report to your exact needs.
One of the options is to schedule the report so that it is automatically emailed to the specified person/s.
This report will then also be added to the left-hand list for future use. Again, the custom report can be exported to excel and pdf.
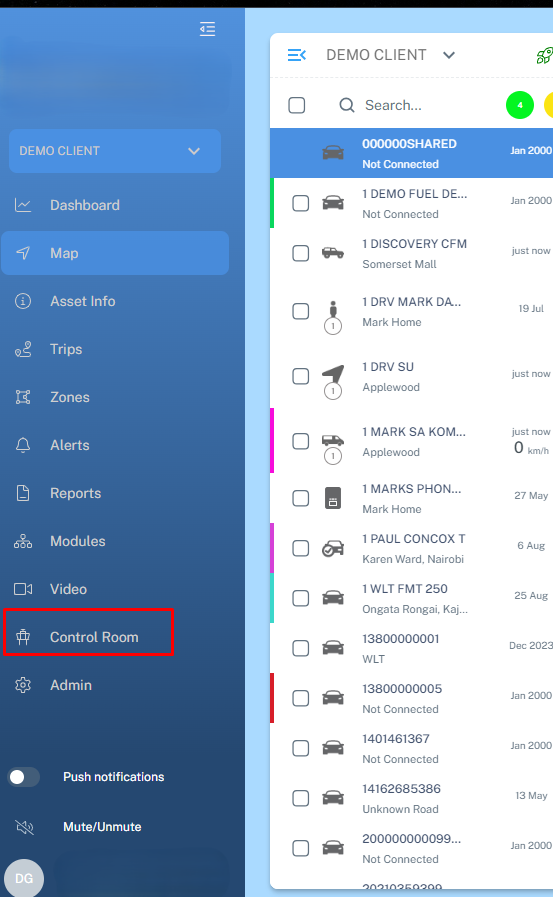
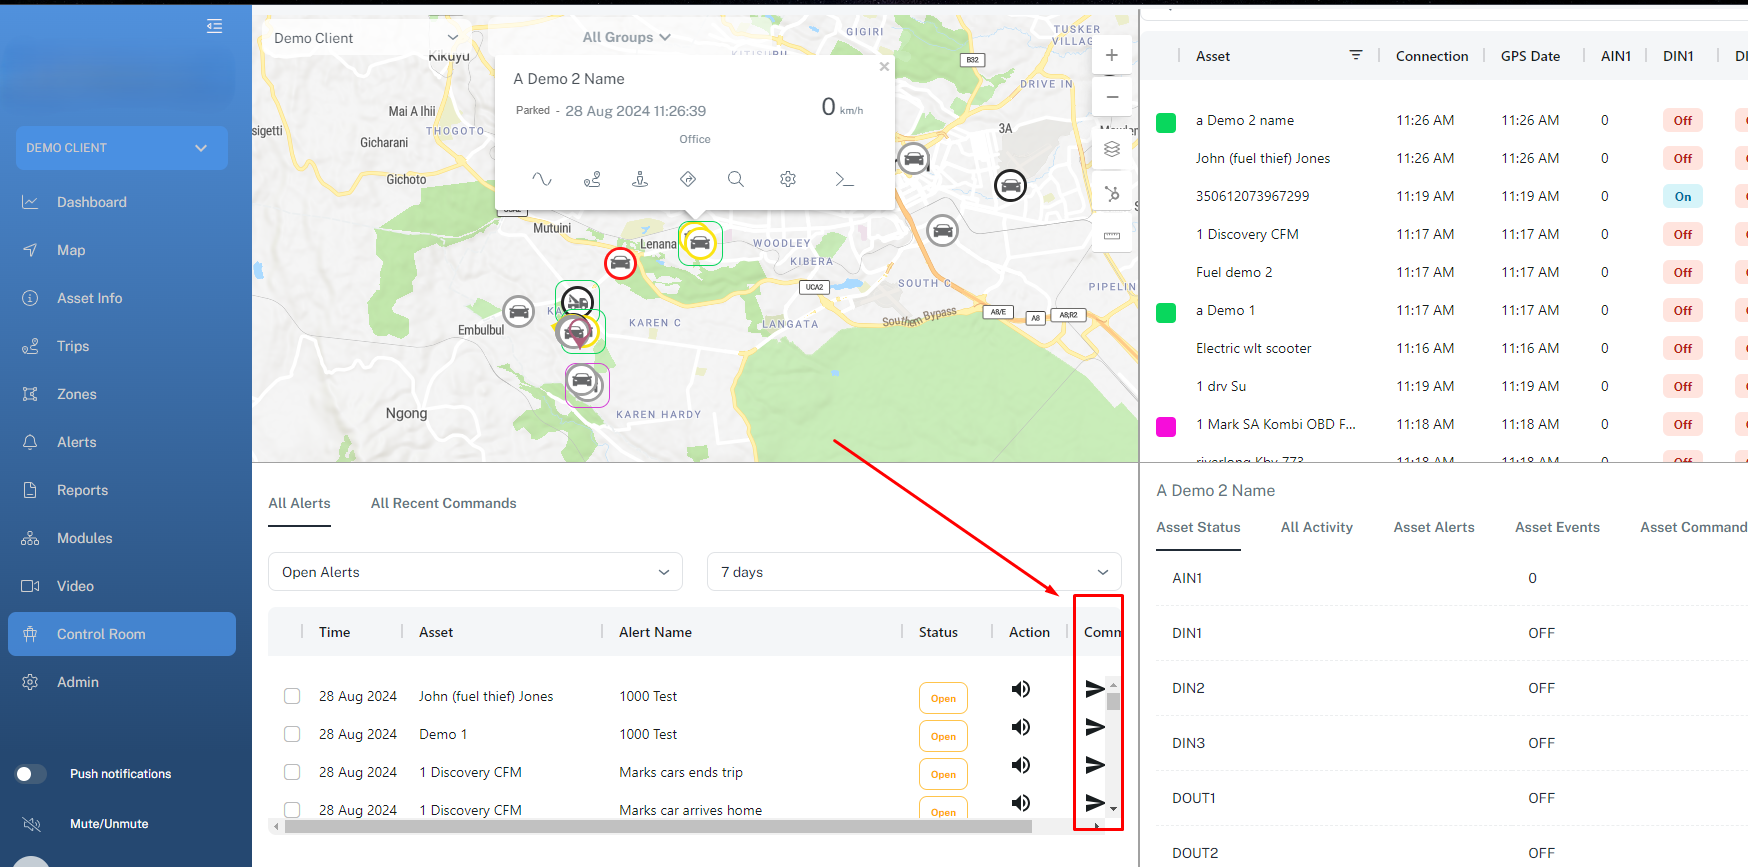
The control room view is a specialized environment designed to monitor and manage a fleet of vehicles in real-time. This setting is essential for ensuring efficient operations, responding to incidents, and providing customer service effectively.
What it entails:
i. Central Command Console
ii. Central Monitoring (Real-Time Tracking Displays on map)
iii. Incident Monitoring ( Alerts and Notifications-onscreen )
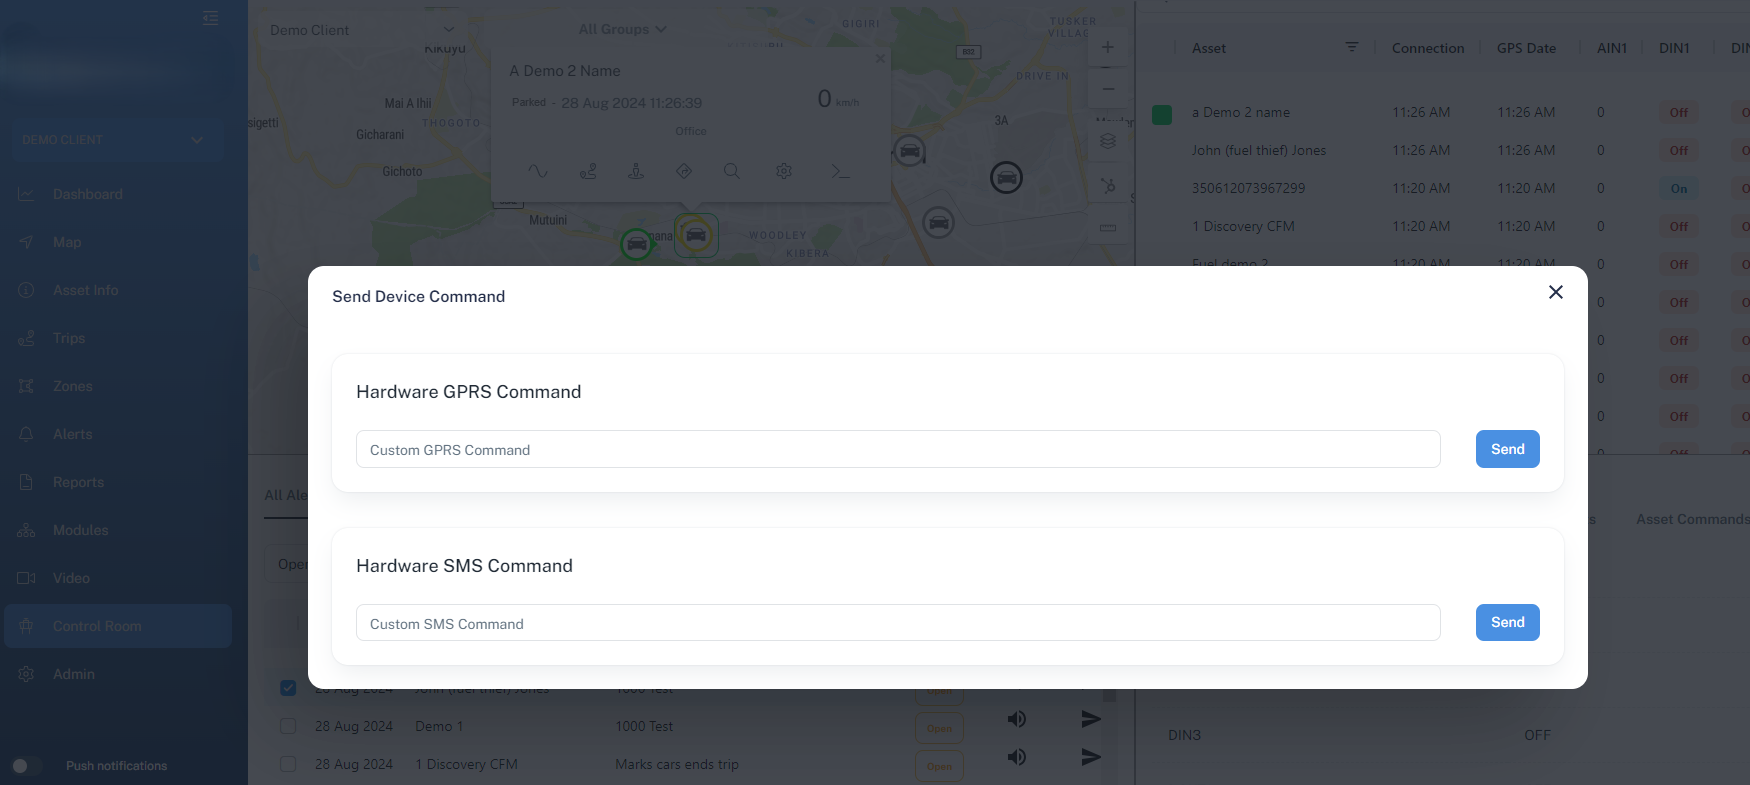
iv. Real-Time Telemetry Data ( inputs and output telemetry)
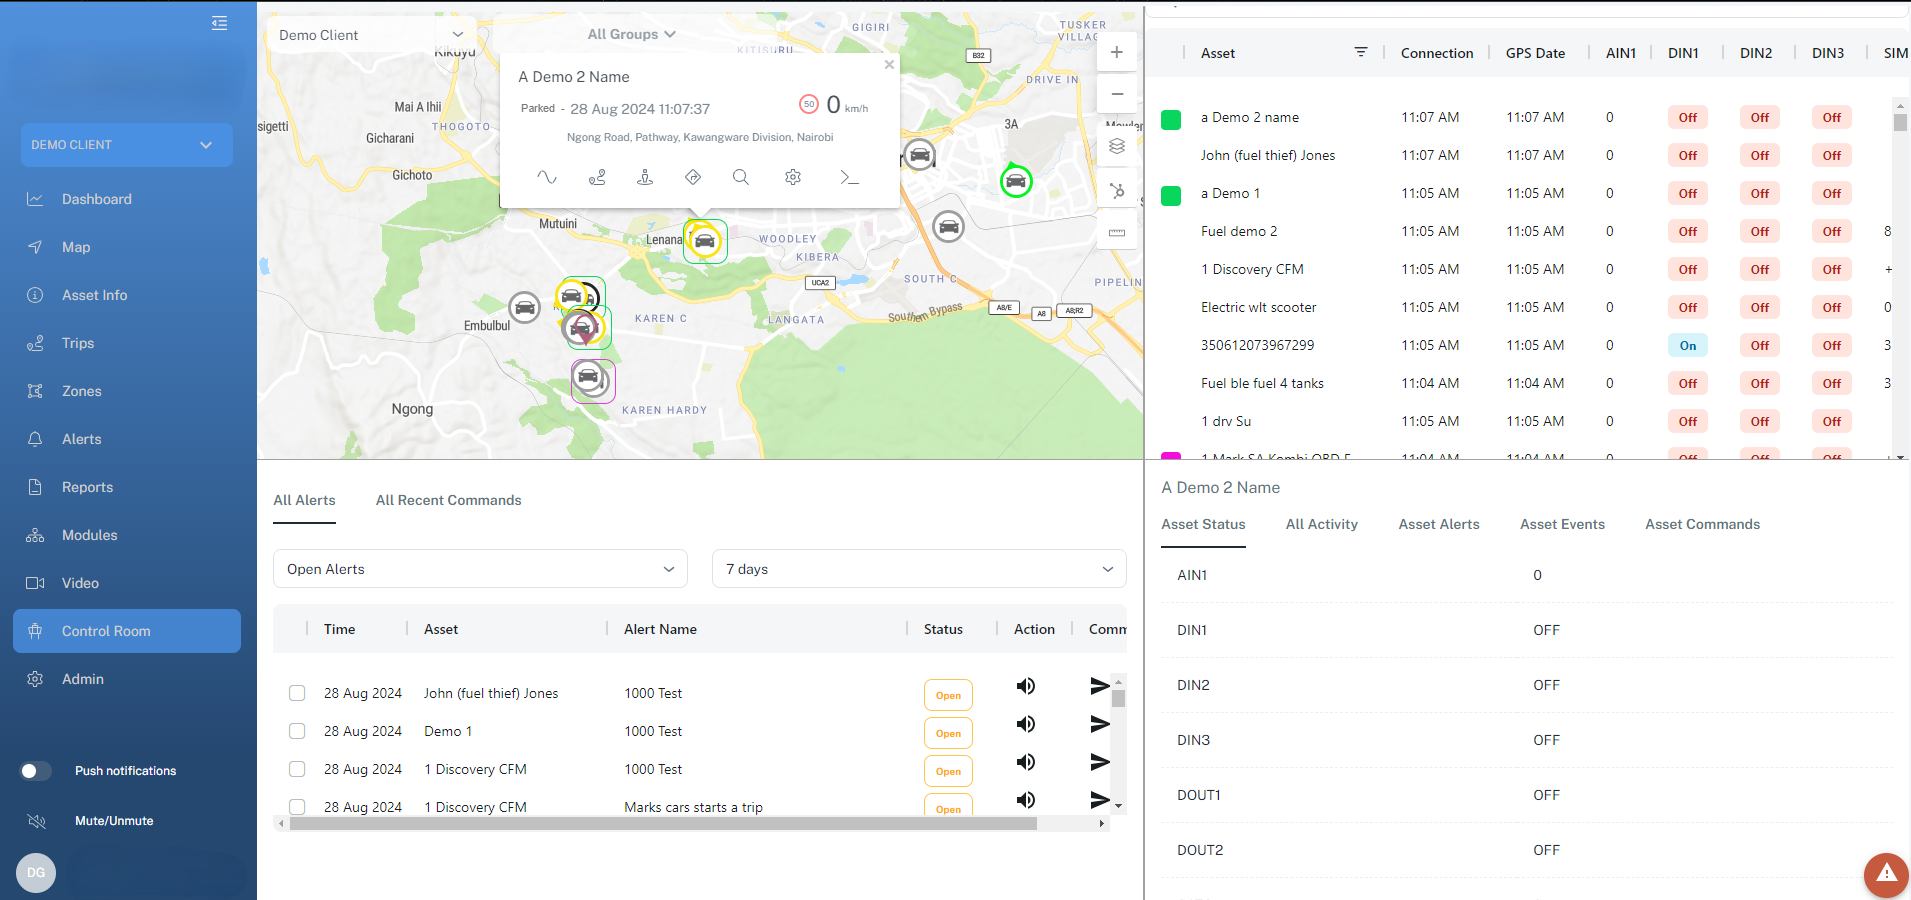
Central Command Console
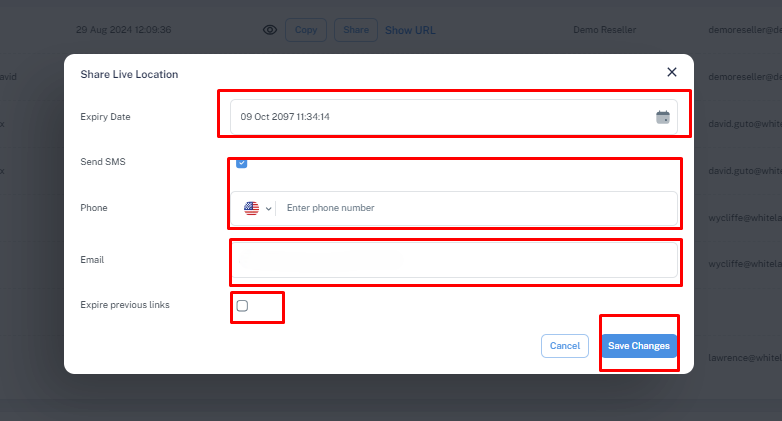
External location sharing refers to the process of sending or broadcasting your asset /vehicle physical location (such as GPS coordinates, address, or a mapped position) to people or systems outside of your Wlt account . The concept is used in personal, social, and business contexts. the link can be password protected .
One asset location sharing:
navigate to asset info>>> external sharing url
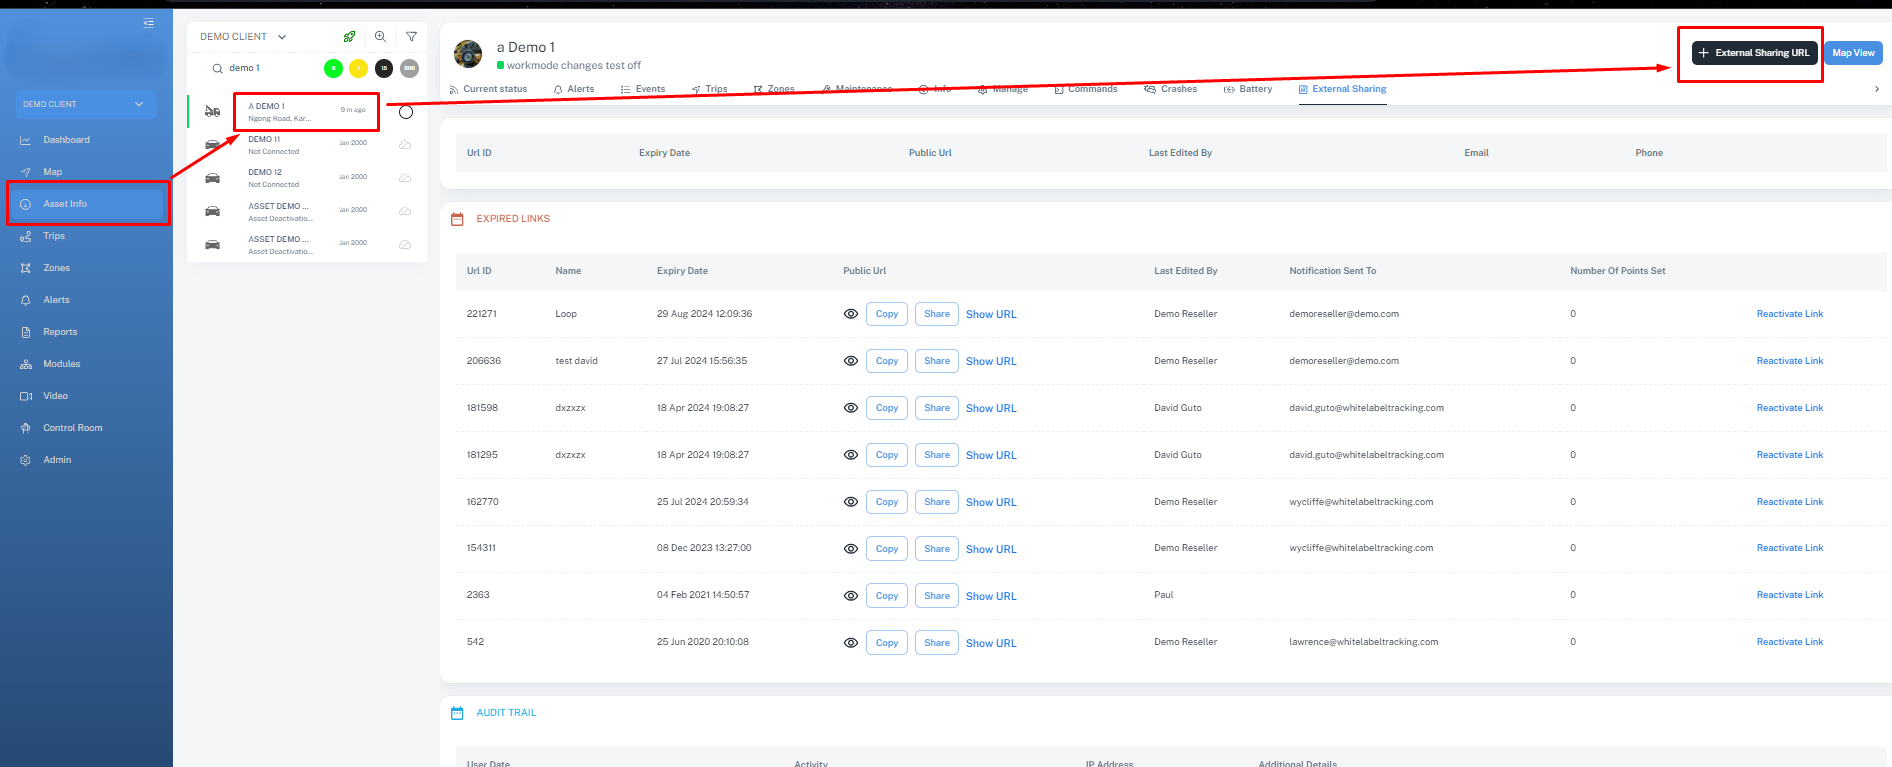
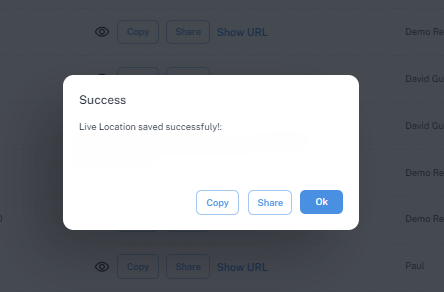
Input the desired parameters
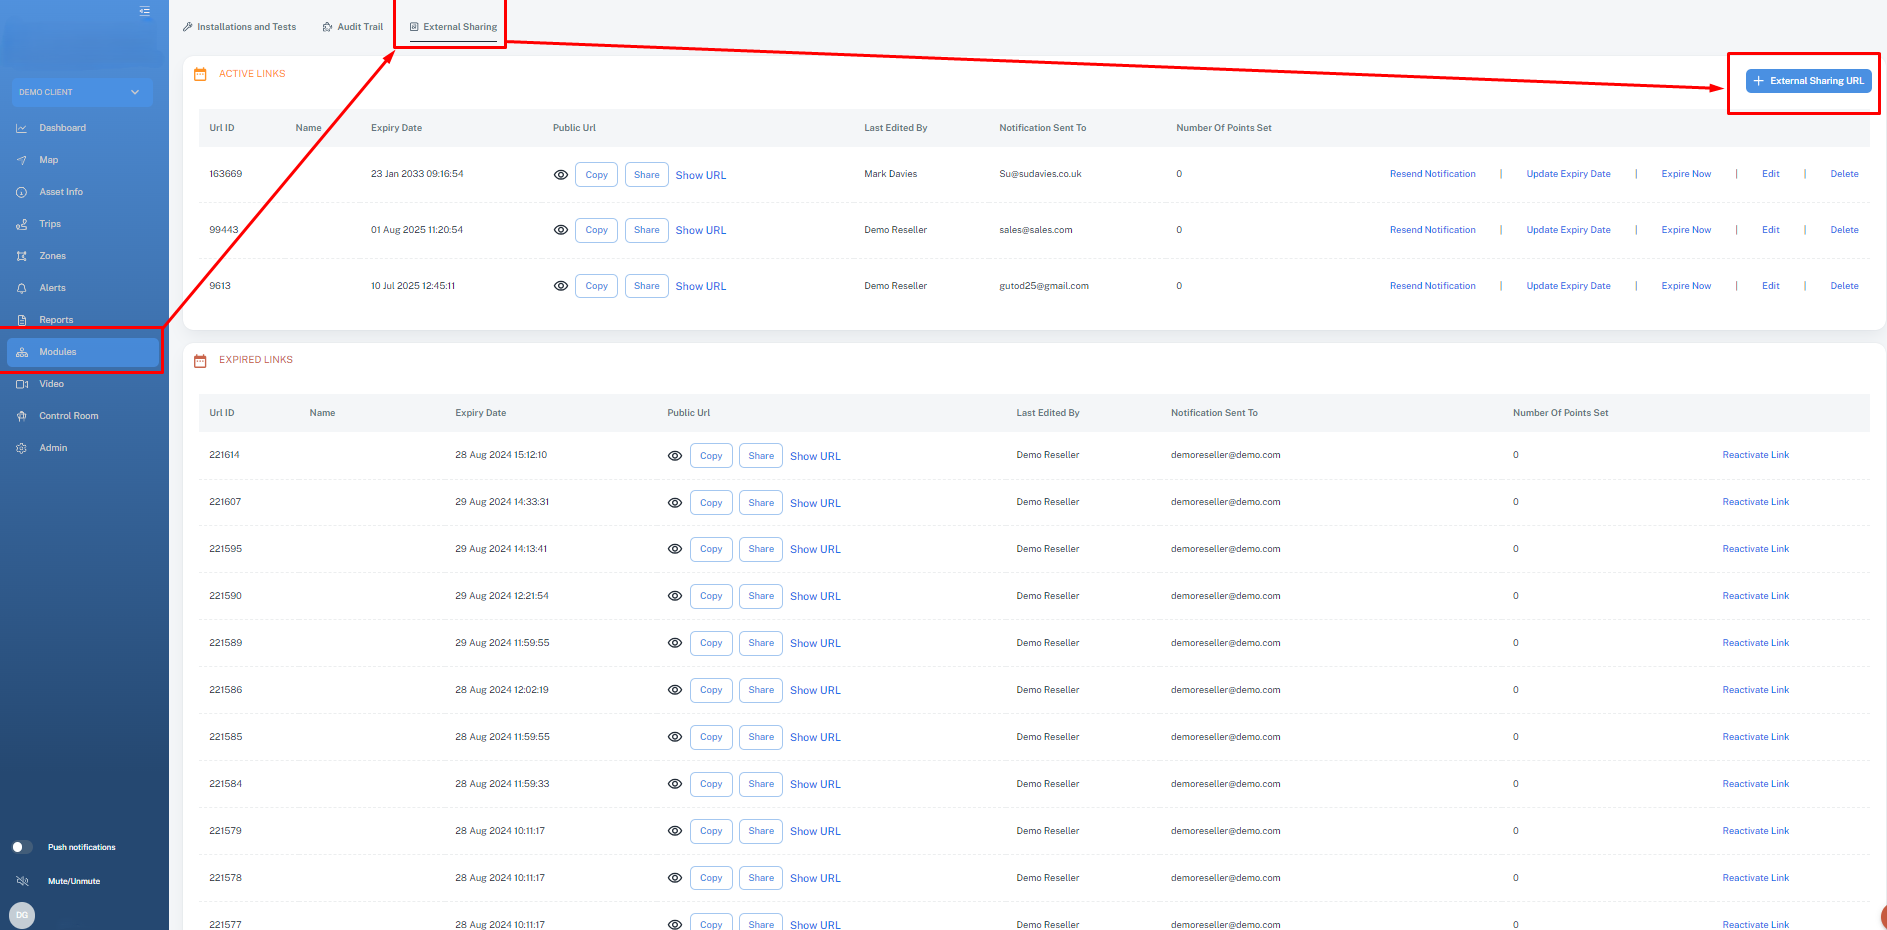
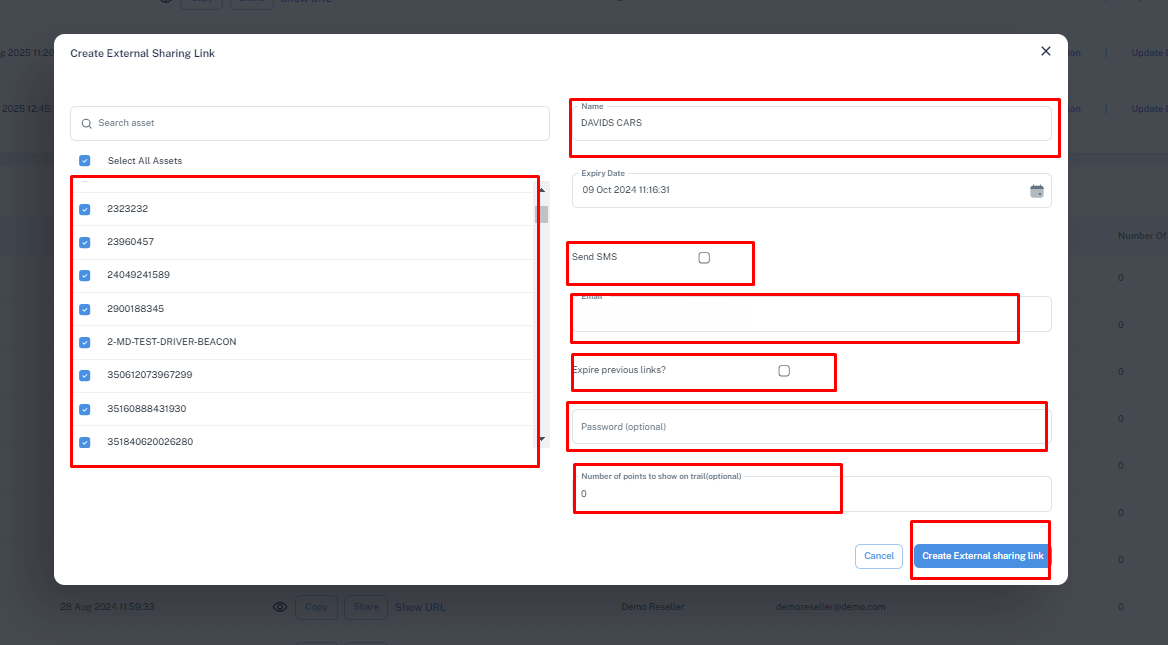
Multiple asset external location sharing link
Video telematics
It refers to the integration of video technology with telematics systems to monitor vehicles and drivers. It combines video footage with data collected from telematics devices, such as GPS, speed sensors, accelerometers, and other diagnostic tools.
The primary purpose of video telematics is to enhance fleet safety, driver behavior analysis, and incident reconstruction.
Use Cases:
Commercial Fleets: Trucking companies use it to monitor drivers and and vehicle assets .
Public Transport: Ensures driver compliance and passenger safety.
Insurance: Usage-based insurance models use video telematics to assess risks.
Ride-sharing: For monitoring passenger interactions and driver behavior.
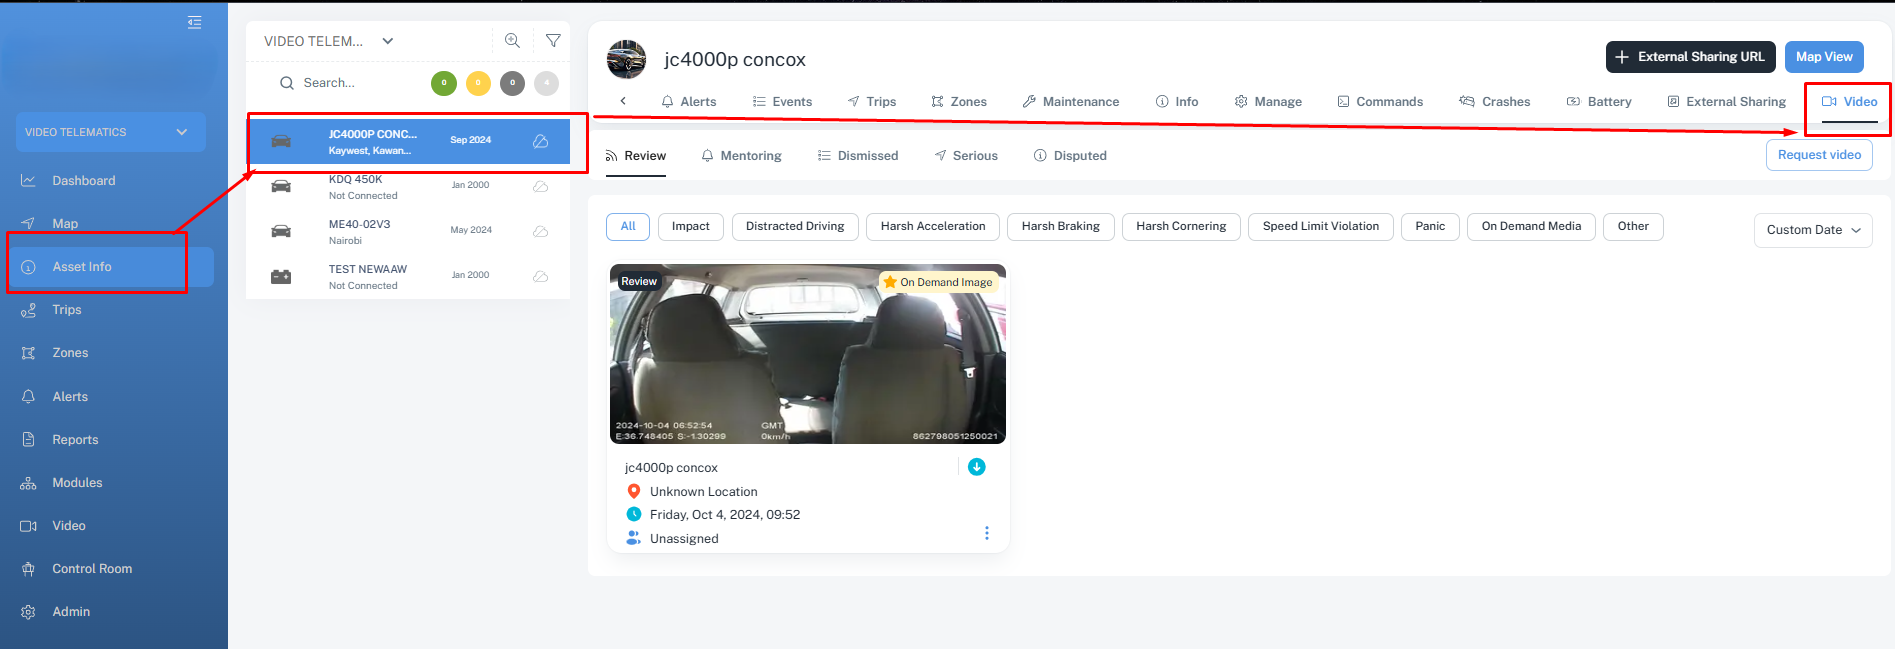
1. Asset specific footage
here you can monitor videos that were collected by specific device .
click on asset info >>>navigate to video tab
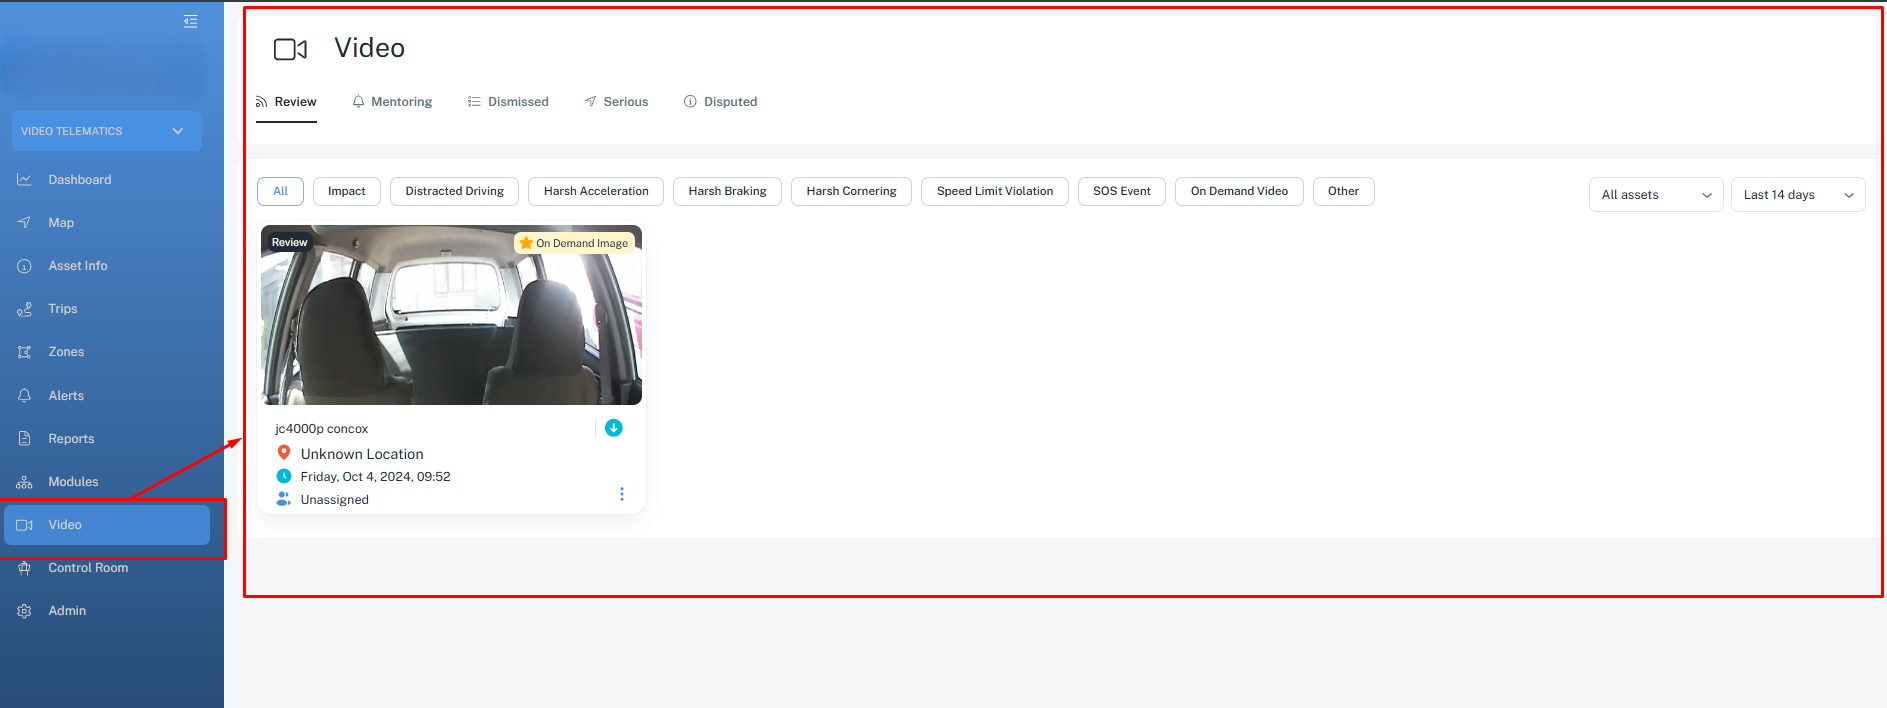
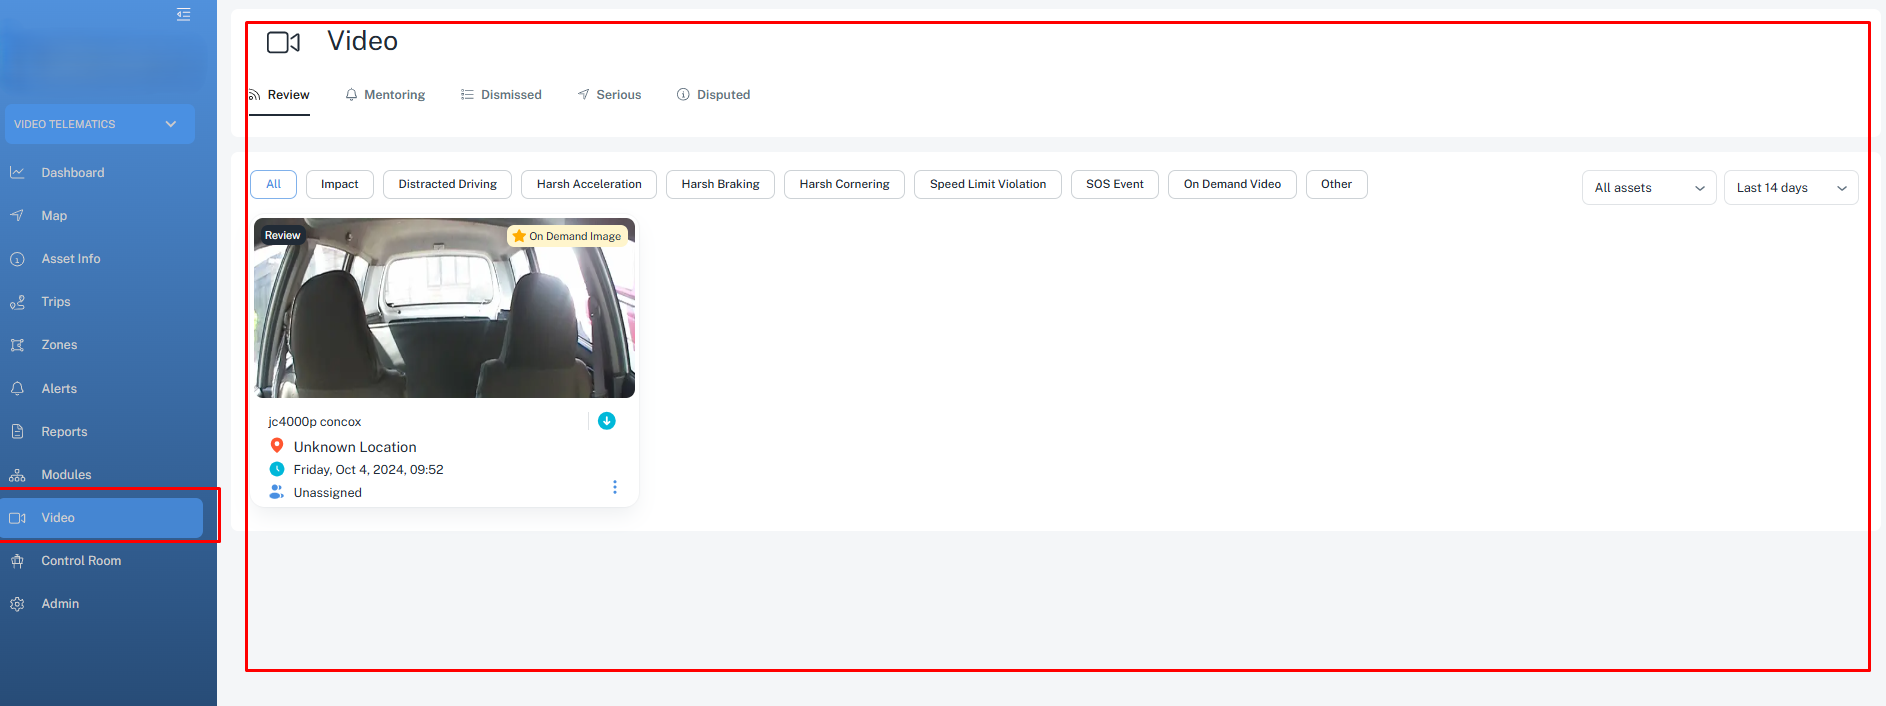
2. Client wide video Footage
You can monitor footage from all device in one screen.
Click on the Video tab
3. individualized per device view
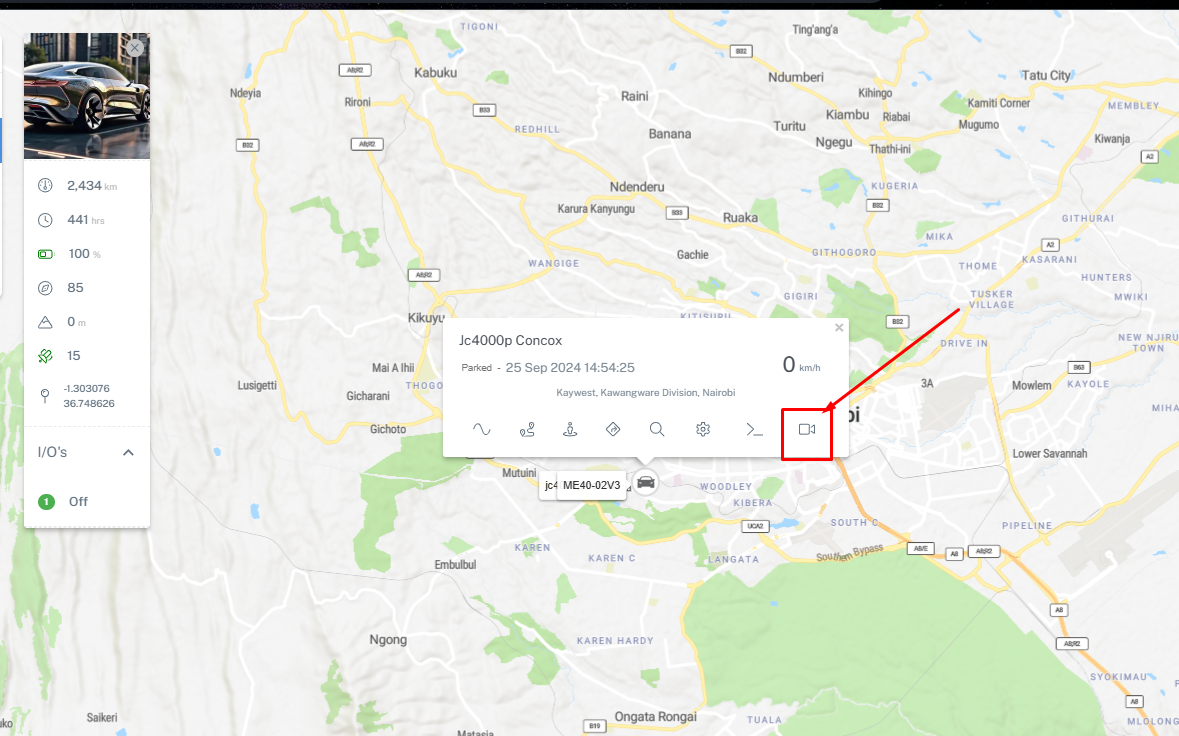
4. We have a shortcut to access video telematics from the asset bubble
Click on DASHBOARD option on the main menu.
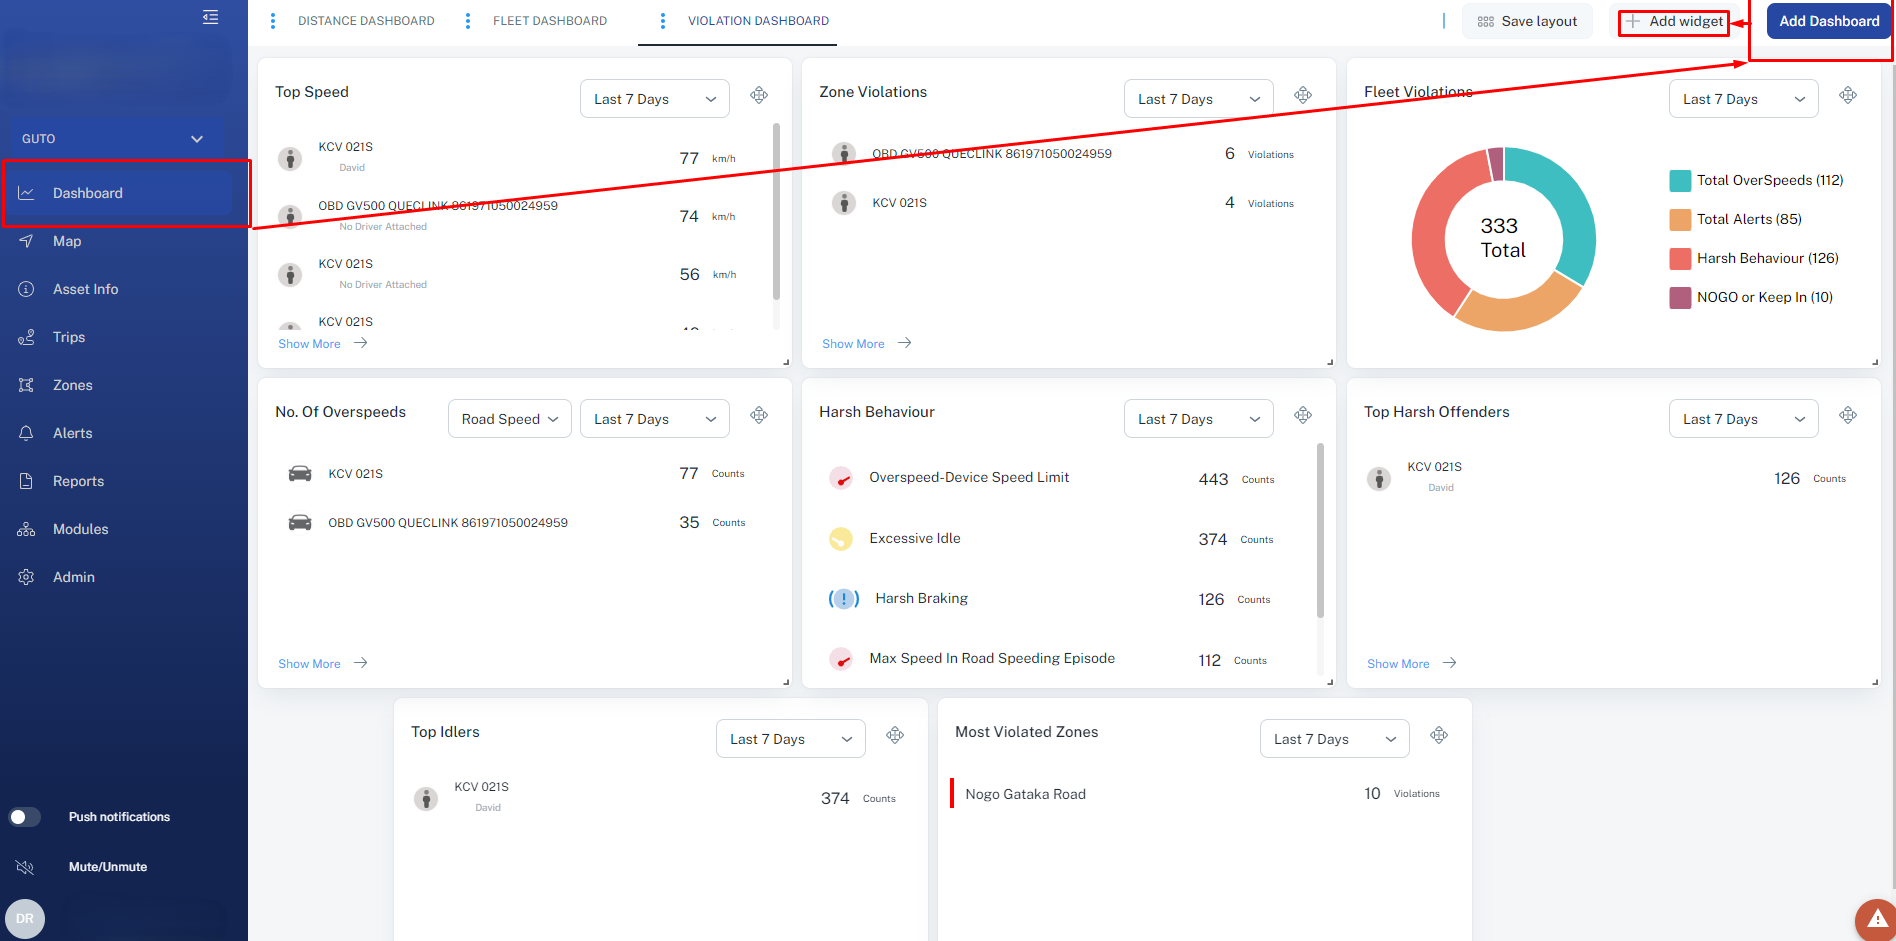
Here you'll browse a collection of dynamic and interactive widgets that can be configured to maintain situational awareness on all aspects and current events.
Combine widgets that are useful for your fleet management tasks and workflow.
You can explore the following widgets:Fleet fuel stats
Number of Alerts
Maintenance
Distance travelled
Total trips
Total violations
Trips heat map
Eco-driving
Reminders
Most visited locations
Number of overspeed warnings
Most violated zones
Top idlers
Distance travelled graph
Top fuel drains
Harsh behaviour
Fleet fuel statistics
To add a dashboard. Click on ADD DASHBOARD button.
Click on ADD WIDGET to add widgets you require. Select from dropdown to select the widget type.